
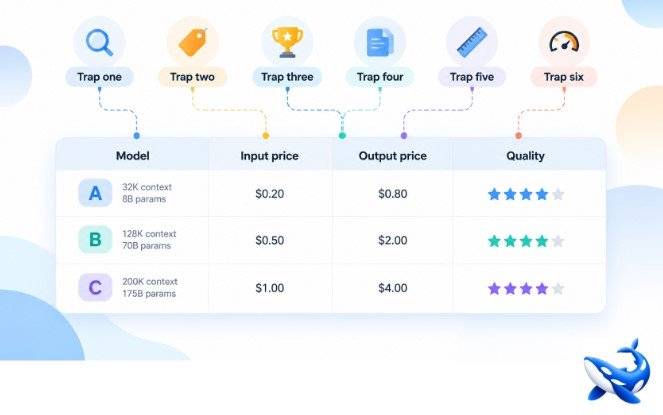
A comparison table looks like a finished decision, but it is usually the start of one, and the fastest way to misread it is to trust a single column. On OrcaRouter the twelve-model llm comparison table pairs every row with production telemetry rather than a press sheet, which makes it an unusually honest table and therefore a good place to learn where the reading goes wrong. Six traps follow, each one grounded in a real row of that table, and each one is a habit of reading a column as if it were the whole verdict.
The table is not the liar; the reading is.
Trap one: the input column is half the bill
Start with the row that looks cheapest. Gemini 3.1 Pro Preview lists an input price of $2.00 per million tokens, which reads as comfortably mid-table, yet its output price is $12.00, a 6.0x multiplier — the steepest output-to-input ratio on the page. A model that mostly writes, or generates long drafts, bills against the output column, and there this row is six times its own input price. kimi-k2.6 shows the same shape in miniature at $0.95 input and $4.00 output, a 4.2x ratio. The price span itself is the trap in disguise: input prices run fifty times across the table, from $0.60 to $30.00, while output prices run ninety-one times, from $1.98 to $180.00. Two rows can look equally cheap in the left-hand column and behave completely differently once real traffic flows, because the input price is only half the bill, and on the write-heavy half the ratio between the two prices can dwarf the sticker. The arithmetic is easy to underestimate. A drafting pipeline that sends in a short instruction and receives a long completion is pricing almost every token at the output rate, and there a 6.0x row charges six dollars of output for every dollar of input while a 3.0x row charges three. Over a week of generated drafts the difference is not a rounding error; it is the difference between a budget line and a surprise.
Trap two and three: the price tag
The second trap is the dearest row. GPT-5.5 Pro lists at $30.00 input and $180.00 output per million tokens, fifty times the cheapest input price in the table, and it carries a 10.0 on our composite quality score — the highest mark, shared with two other rows. A glance at the price column says this must be the best model. Look down a few rows and the glance fails: DeepSeek V4 Pro charges $0.66 input and $1.98 output and still earns 8.0 on the same composite scale, which is our own 0–10 built in-house from reasoning, instruction-following and reliability, and not a third-party benchmark. Roughly thirty dollars of list price buys two points of composite score, and for a large share of real workloads those two points do not change the recommendation. The cheapest row in the whole table, MiniMax M2.7 highspeed at $0.60, also earns 8.0, so eleven of the twelve rows sit inside a two-point band from 8.0 to 10.0 while the price column spans fifty times. Nor does the price column buy a faster first token: two mid-price rows, Gemini 3.1 Pro Preview at $2.00 and GPT-5.4 at $2.50, sit pinned at the 10.00 s ceiling, the cap of the measurement window rather than a real observed value.
The third trap is its mirror image: equal price does not mean equal value. Two rows share the top composite mark of 10.0 on our own in-house scale (reasoning, instruction-following and reliability, 0–10): Claude Fable 5.1 and Gemini 3.1 Pro Preview. The rate cards disagree wildly. Fable 5.1 charges $10 input and $50 output per million tokens, while the Preview row charges $2 and $12. The same composite number sits on a card that is five times dearer on input and about 4.2 times dearer on output. Neither the price column nor the quality column can separate these two rows on its own, so the decision has to come from somewhere else in the table — usually the context column or the traffic column, where the two rows are far apart.
Trap four: the leaderboard column
The fourth trap is picking one benchmark and letting it crown a winner. On the independent aggregator we read for this article, Claude Fable 5.1 holds the top coding score: 81.6, ranked first of 138 models. The highest intelligence reading anywhere in this table belongs to a different model entirely — Claude Opus 5.5 at 57.6, ranked fourth of 147. Same page, two columns, two different leaders. If you arrived asking which model is best, the honest answer is “which column do you mean,” and any article that answers without that caveat has already fallen in. The same part of the table springs a preview trap. Gemini 3.1 Pro Preview posts a coding score of 68.8, ranked 30th of 138, while its cheaper sibling Gemini 3.8 Flash posts 76.3, ranked eighth. The pricier Preview card loses the coding column to the budget Flash card, which is a reminder that a product name that sounds like an upgrade does not predict the column wins.
Trap five: the context column
The fifth trap is assuming the context window is one number that applies to everyone. Eight of the twelve rows here carry a 1M context window, but Grok 4.7 stops at 500K, kimi-k2.6 at 262K, and MiniMax M2.7 highspeed at 205K, while GPT-5.5 Pro does not publish its context window at all. A single document of 300,000 tokens eliminates kimi-k2.6 and MiniMax M2.7 highspeed outright and leaves GPT-5.5 Pro in doubt, because an unpublished window is an unverified one. Before any price is consulted, the workload has already decided who qualifies, and every column you compared before checking the context column was time spent comparing rows that cannot take the job.
Trap six: the usage column
The last trap is skipping the column that most people skip first: how much traffic each row actually carried. Over the trailing seven days, DeepSeek V4 Pro moved 512.0M tokens and Gemini 3.8 Flash moved 335.5M, while the dearest card in the table, Claude Fable 5.1, moved 7.4M and GPT-5.5 Pro moved just 101.8K. These are rolling figures and they drift, but the shape does not: the market votes with real traffic, and the votes went to the cheap rows. If you read a comparison table and ignore the usage column, you will conclude that the expensive flagship is the centre of the market, which is the opposite of what the table shows. The usage column is the difference between knowing which models people praise and knowing which models people actually run. It is also a rolling number, and the table’s own definition is explicit: the figure is the token volume of the trailing seven days, so it drifts with the week. Treat it as a direction and a magnitude, not as a fixed fact.

The takeaway
A model comparison table is trustworthy when every column carries real data, and it is still easy to misread, because each trap lives in the way one column is allowed to stand for the whole decision. Read the input price and the output price as two different bills. Read the composite quality score as our own in-house 0–10 across reasoning, instruction-following and reliability, not as an external verdict. Read a benchmark with its column name and its denominator. Read the context window against your actual document. Read the usage column as a market vote. And never let the dearest row, or the cheapest row, or the row with the friendliest product name, do the thinking for you. Do all six, and the same table that fooled you once becomes a shortlist. The trick is to remember that the table’s job is to feed a decision, not to make one, and the columns that feed it are the ones that measure your workload — the output bill you will actually pay, the context you will actually send, the composite score understood for what it is.






Leave a Reply